Do you hear what I hear? Comparing boat traffic at the surface to the sounds killer whales experience

Here I am in the San Juans collecting data for the DTAG study in June 2011. Photo: B. Houghton
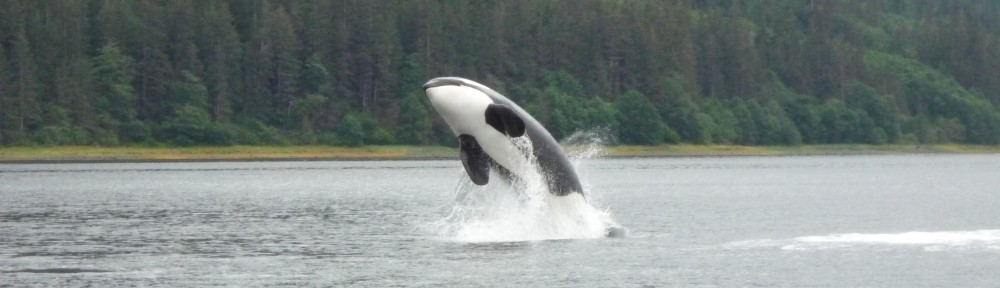
Our local killer whales (Southern Resident community, SRKW) are endangered because of a few important factors. They are food-limited because they eat salmon that are also endangered or threatened. They have to deal with pollution and contaminants. And they also are sharing a noisy environment with us in our coastal waters where boats and the sound they produce are harmful. In the Pacific Northwest, we love our killer whales. We love them so much that we want to be near them – and what better way than to go on a whale-watching trip? Whale-watching is great for spreading education about our whales, but what if the boats, or how they behave, make it too noisy for whales to communicate and catch fish?

DTAG on SRKW, September 2010. Photo: C. Emmons © NOAA Northwest Fisheries Science Center, taken under permit
From previous research, we know that SRKW are affected by boats and the noise boats produce, but we still don’t know what the whales actually hear as they dive and travel through the water. This is where the Dtag (digital acoustic recording tag) comes in. We can attach this to a whale for a few hours by sticking it on with it’s suction cups. The tag has hydrophones (underwater microphones) so that we can actually eavesdrop on the whales and hear what noises they are exposed to. At the same time, we are recording data at the surface with equipment packages that have been modified from the road survey industry. This equipment allows us to record the exact location in space and time for the whale each time it comes to the surface, and for each boat within a kilometer. Characteristics like the size, speed, and orientation of the boat, are also recorded.

An example of vessel traffic data collected that will be used in this study. Vessel tracks are the thin white lines. SRKW individual K33’s track is the thick yellow line. Also available at http://www.cascadiaresearch.org/kws/dtagging.htm
My MS research will compare the two datasets: noise levels recorded on the tag and the boat traffic characteristics from the surface. I will use some statistics, modeling, and spatial analyses to answer the question – how do boats make it noisier in killer whale habitat? Is it how many boats are in the area or how fast they are going that makes it loudest? Are bigger boats louder or is it because of a certain motor type? Hopefully answering these types of questions will make it so that we can change how we use our boats around whales so that we can be as quiet as possible. By limiting our noise pollution, whales can communicate and catch fish in a more suitable sound environment, maybe allowing their population to recover.
Check out some preliminary analyses with a poster I presented in 2012 – It won best student poster at the Annual SAFS Graduate Student Symposium.
Research conducted in collaboration with NOAA Northwest Fisheries Science Center, Cascadia Research Collective, UC Davis, and UW School of Aquatic & Fishery Sciences.
Whale Occurrence Changes as Prey Abundance Increases: Transient killer whales in southern British Columbia and Washington State from 1987-2010

Transient killer whale attacking a sea lion in the Salish Sea. Photo: C. Emmons, © NOAA Northwest Fisheries Science Center, taken under permit
The primary prey of mammal-eating killer whales in the Salish Sea, seals, sea lions, and porpoises, have increased in the last 25 years. Whether this increase has resulted in changes in their predator, Transient killer whales, is not known.
We analyzed sightings of mammal-eating killer whale from two time periods: 1987-1993 and 2004-2010. Changes in occurrence (whether the whales were in the area or not) were examined across years, months, and areas of the Salish Sea. We also examined changes in group size, and in the groups (matrilines) using the area.
There was an increasing trend in the occurrence of transient killer whales from 2004-2010 with seasonal peaks in April-May and August-September. From 1987-1993, there was only one seasonal peak in August-September. The most common group size was four whales for 2004-2010. This group size is larger than the size most often observed from 1987-1993, and group size also seems to be increasing over time from 2004-2010.
We think the whales are increasing use of the Salish Sea due to increasing prey abundance. Changes in seasonal patterns of occurrence and the increase in group size between the two periods could be due to increased prey diversity (they are eating more than just one or two prey species). We think prey diversity could explain this change because prey species occurrence varies seasonally and optimum foraging group size changes by prey species. Increased prey abundance could also relax the need to forage in the optimum group size and increase whale reproduction, leading to larger groups. These findings will provide greater insight into predator-prey relationships.
Houghton, J., Baird, R.W., Emmons, C.K., Hanson, M.B. In prep. Predator occurrence changes as prey abundance increases: studies of mammal-eating killer whales in southern British Columbia and Washington state from 1987 – 2010.
Research conducted in collaboration with NOAA Northwest Fisheries Science Center and Cascadia Research Collective.
Distribution & Movements of Gray Whales in the Pacific Northwest Using GIS

Here I am participating in a NOAA NMML gray whale survey in Summer 2009. Photo: P. Gearin
As part of my NOAA Hollings undergraduate internship, I worked with the National Marine Mammal Laboratory to analyze gray whale movement behavior using a geographic information system (GIS). Throughout the summer, I also got to participate in a variety of research efforts, such as gray whale surveys and photo-identification.

Gray whale in the Strait of Juan de Fuca, August 2009. Photo: J. Houghton, taken under permit
I used ArcGIS software to create maps of the distribution of gray whales sighted along the WA, OR, and BC coasts. I also created maps that demonstrated individual movement patterns on an annual and seasonal basis that were far more expansive than previously understood.
Research conducted in collaboration with NOAA National Marine Mammal Laboratory.

Pingback: September in the San Juans – Killer Whale Field Work 2012 | Juliana Houghton